2019-04-25 00:03:47 +00:00
# Sampler. Visualization for any shell command.
[](https://travis-ci.com/sqshq/sampler) [](https://goreportcard.com/report/github.com/sqshq/sampler)
2019-04-20 04:30:13 +00:00
Sampler is a tool for shell commands execution, visualization and alerting. Configured with a simple YAML file.
2019-04-19 03:50:48 +00:00
2019-04-20 04:30:13 +00:00
## Installation
### macOS
2019-06-18 04:49:53 +00:00
```bash
sudo curl -Lo /usr/local/bin/sampler https://github.com/sqshq/sampler/releases/download/v0.9.1-beta/sampler-0.9.1-darwin-amd64
sudo chmod +x /usr/local/bin/sampler
```
2019-04-20 04:30:13 +00:00
### Linux
2019-06-18 04:49:53 +00:00
```bash
sudo curl -Lo /usr/local/bin/sampler https://github.com/sqshq/sampler/releases/download/v0.9.1-beta/sampler-0.9.1-linux-amd64
sudo chmod +x /usr/local/bin/sampler
```
2019-04-20 04:30:13 +00:00
### Windows
2019-06-18 04:49:53 +00:00
[download .exe ](https://github.com/sqshq/sampler/releases/download/v0.9.1-beta/sampler-0.9.1-windows )
2019-04-20 04:30:13 +00:00
## Usage
2019-04-25 00:03:47 +00:00
You specify shell commands, Sampler executes them with a required rate. The output is used for visualization.
One can sample any dynamic process right from the terminal - observe changes in the database, monitor MQ in-flight messages, trigger deployment process and get notification when it's done.
Using Sampler is basically a 3-step process:
2019-04-20 04:30:13 +00:00
- Define your configuration in a YAML file
- Run `sampler -c config.yml`
2019-04-25 00:03:47 +00:00
- Adjust components size and location on UI
2019-04-20 04:30:13 +00:00
2019-06-11 03:01:37 +00:00
## Contents
2019-04-20 04:30:13 +00:00
2019-04-25 00:03:47 +00:00
- [Components ](#components )
- [Runchart ](#runchart )
- [Sparkline ](#sparkline )
- [Barchart ](#barchart )
- [Gauge ](#gauge )
- [Textbox ](#textbox )
- [Asciibox ](#asciibox )
- [Bells and whistles ](#bells-and-whistles )
- [Triggers (conditional actions) ](#triggers )
2019-06-11 03:11:53 +00:00
- [Interactive shell (database interaction, remote server access, etc) ](#interactive-shell-support )
2019-04-25 00:03:47 +00:00
- [Variables ](#variables )
- [Color theme ](#color-theme )
- [Real-world examples (contributions welcome) ](#real-world-examples )
2019-04-20 04:30:13 +00:00
2019-06-11 03:01:37 +00:00
## Components
2019-06-11 03:11:53 +00:00
The following is a list of configuration examples for each component type, with macOS compatible sample scripts.
2019-06-11 03:01:37 +00:00
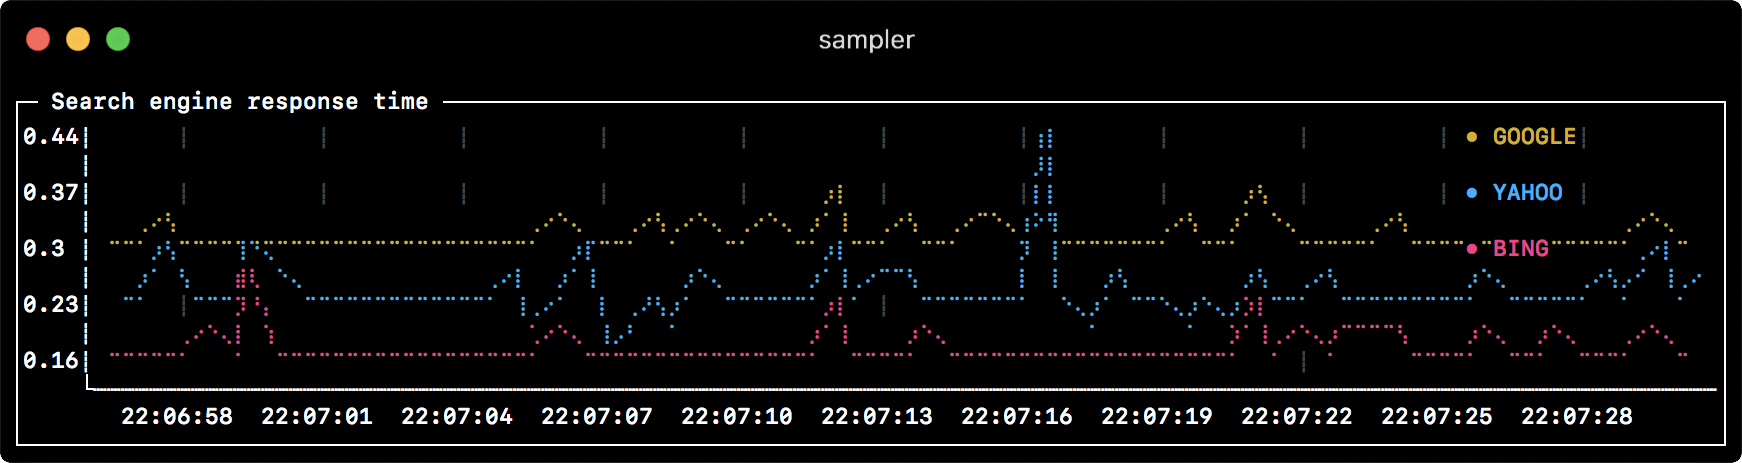
### Runchart
2019-06-10 02:21:26 +00:00
2019-04-25 00:03:47 +00:00
```yml
runcharts:
- title: Search engine response time
rate-ms: 500 # sampling rate, default = 1000
scale: 2 # number of digits after sample decimal point, default = 1
legend:
enabled: true # enables item labels, default = true
details: false # enables item statistics: cur/min/max/dlt values, default = true
items:
- label: GOOGLE
sample: curl -o /dev/null -s -w '%{time_total}' https://www.google.com
color: 178 # 8-bit color number, default one is chosen from a pre-defined palette
- label: YAHOO
sample: curl -o /dev/null -s -w '%{time_total}' https://search.yahoo.com
- label: BING
2019-06-10 02:21:26 +00:00
sample: curl -o /dev/null -s -w '%{time_total}' https://www.bing.com
2019-04-25 00:03:47 +00:00
```
2019-06-11 03:01:37 +00:00
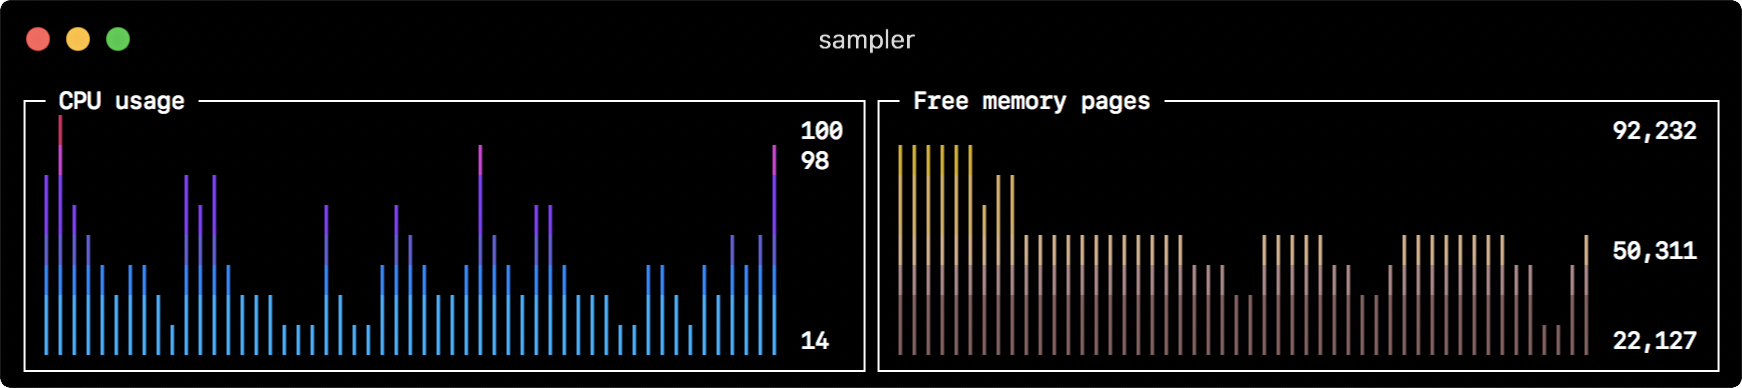
### Sparkline
2019-06-10 02:21:26 +00:00
2019-04-25 00:03:47 +00:00
```yml
sparklines:
2019-06-10 02:21:26 +00:00
- title: CPU usage
rate-ms: 200
scale: 0
sample: ps -A -o %cpu | awk '{s+=$1} END {print s}'
- title: Free memory pages
rate-ms: 200
scale: 0
sample: memory_pressure | grep 'Pages free' | awk '{print $3}'
2019-04-25 00:03:47 +00:00
```
2019-06-11 03:01:37 +00:00
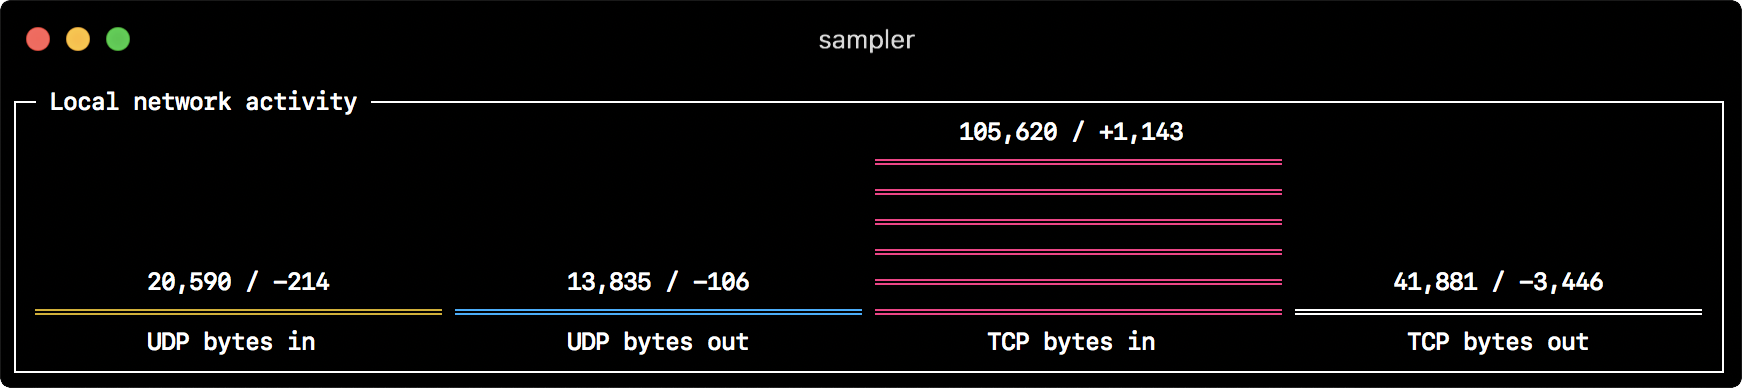
### Barchart
2019-06-10 02:21:26 +00:00
2019-04-25 00:03:47 +00:00
```yml
barcharts:
- title: Local network activity
rate-ms: 500 # sampling rate, default = 1000
scale: 0 # number of digits after sample decimal point, default = 1
items:
- label: UDP bytes in
sample: nettop -J bytes_in -l 1 -m udp | awk '{sum += $4} END {print sum}'
- label: UDP bytes out
sample: nettop -J bytes_out -l 1 -m udp | awk '{sum += $4} END {print sum}'
- label: TCP bytes in
sample: nettop -J bytes_in -l 1 -m tcp | awk '{sum += $4} END {print sum}'
- label: TCP bytes out
sample: nettop -J bytes_out -l 1 -m tcp | awk '{sum += $4} END {print sum}'
```
2019-06-11 03:01:37 +00:00
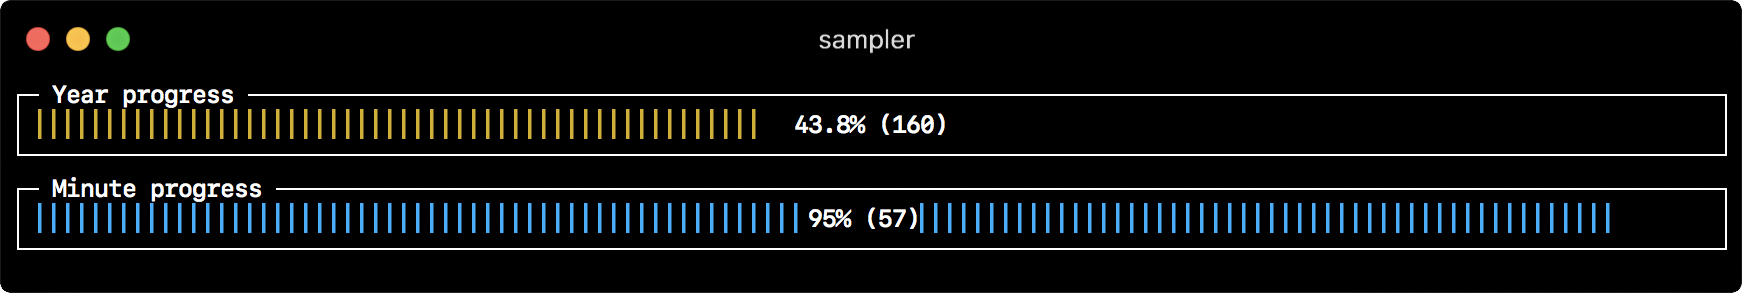
### Gauge
2019-06-12 02:14:54 +00:00
2019-04-25 00:03:47 +00:00
```yml
gauges:
- title: Minute progress
rate-ms: 500 # sampling rate, default = 1000
scale: 2 # number of digits after sample decimal point, default = 1
2019-06-10 02:21:26 +00:00
color: 178 # 8-bit color number, default one is chosen from a pre-defined palette
2019-04-25 00:03:47 +00:00
cur:
sample: date +%S # sample script for current value
max:
sample: echo 60 # sample script for max value
min:
sample: echo 0 # sample script for min value
2019-06-10 02:21:26 +00:00
- title: Year progress
cur:
sample: date +%j
max:
sample: echo 365
min:
sample: echo 0
2019-04-25 00:03:47 +00:00
```
2019-06-11 03:01:37 +00:00
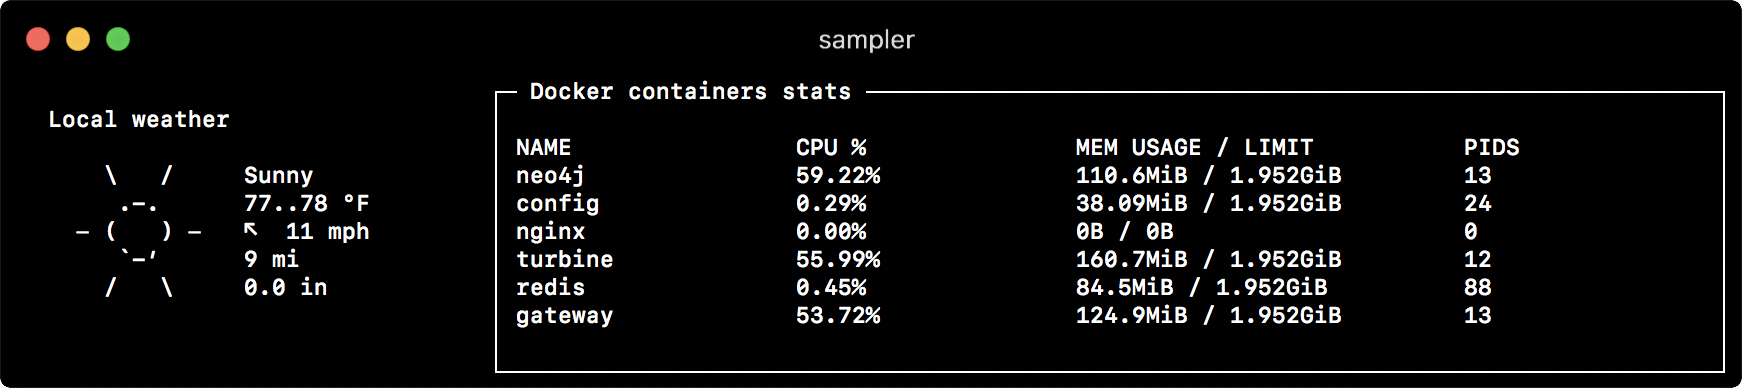
### Textbox
2019-06-10 02:36:35 +00:00
2019-04-25 00:03:47 +00:00
```yml
textboxes:
- title: Local weather
rate-ms: 10000 # sampling rate, default = 1000
sample: curl wttr.in?0ATQF
border: false # border around the item, default = true
color: 178 # 8-bit color number, default is white
- title: Docker containers stats
rate-ms: 500
sample: docker stats --no-stream --format "table {{.Name}}\t{{.CPUPerc}}\t{{.MemUsage}}\t{{.PIDs}}"
```
2019-06-11 03:01:37 +00:00
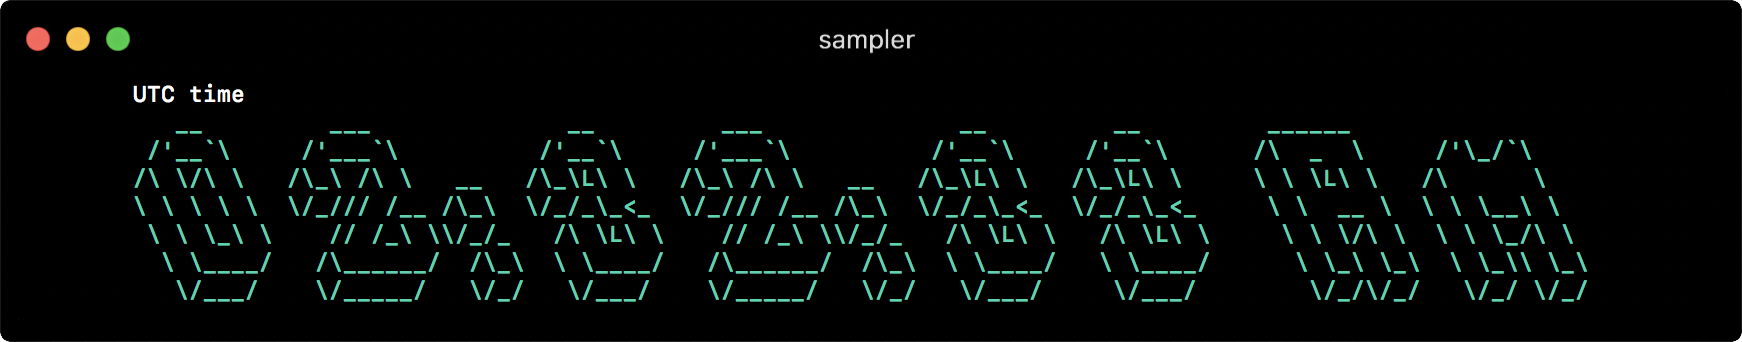
### Asciibox
2019-06-10 02:42:54 +00:00
2019-04-25 00:03:47 +00:00
```yml
asciiboxes:
- title: UTC time
rate-ms: 500 # sampling rate, default = 1000
font: 3d # font type, default = 2d
2019-06-10 02:42:54 +00:00
border: false # border around the item, default = true
2019-06-10 02:36:35 +00:00
color: 43 # 8-bit color number, default is white
2019-04-25 00:03:47 +00:00
sample: env TZ=UTC date +%r
```
2019-04-20 04:30:13 +00:00
2019-06-11 03:01:37 +00:00
## Bells and whistles
2019-04-20 04:30:13 +00:00
2019-06-11 03:01:37 +00:00
### Triggers
2019-04-25 00:03:47 +00:00
Triggers allow to perform conditional actions, like visual/sound alerts or an arbitrary shell command.
2019-04-20 04:30:13 +00:00
2019-06-11 03:01:37 +00:00
### Interactive shell support
2019-04-25 00:03:47 +00:00
In addition to the `sample` command, one can specify `init` command (executed only once before sampling) and `transform` command (to post-process `sample` command output). That covers interactive shell use case, e.g. to establish connection to a database only once, and then perform polling within interactive shell session. MongoDB example: ...
2019-04-20 04:30:13 +00:00
2019-06-11 03:01:37 +00:00
### Variables
2019-04-25 00:03:47 +00:00
If the configuration file contains repeated patterns, they can be extracted into the `variables` section.
Also variables can be specified using `-v` /`--variable` flag on startup, and any system environment variables will also be available in the scripts.
2019-04-20 04:30:13 +00:00
2019-06-11 03:01:37 +00:00
### Color theme
2019-04-25 00:03:47 +00:00
...
2019-04-20 04:30:13 +00:00
2019-06-11 03:01:37 +00:00
## Real-world examples
2019-04-25 00:03:47 +00:00
...