|
|
||
|---|---|---|
| asset | ||
| client | ||
| component | ||
| config | ||
| console | ||
| data | ||
| event | ||
| storage | ||
| .gitignore | ||
| .travis.yml | ||
| LICENSE | ||
| README.md | ||
| example-interactive-shell.yml | ||
| example.yml | ||
| go.mod | ||
| go.sum | ||
| main.go | ||
README.md
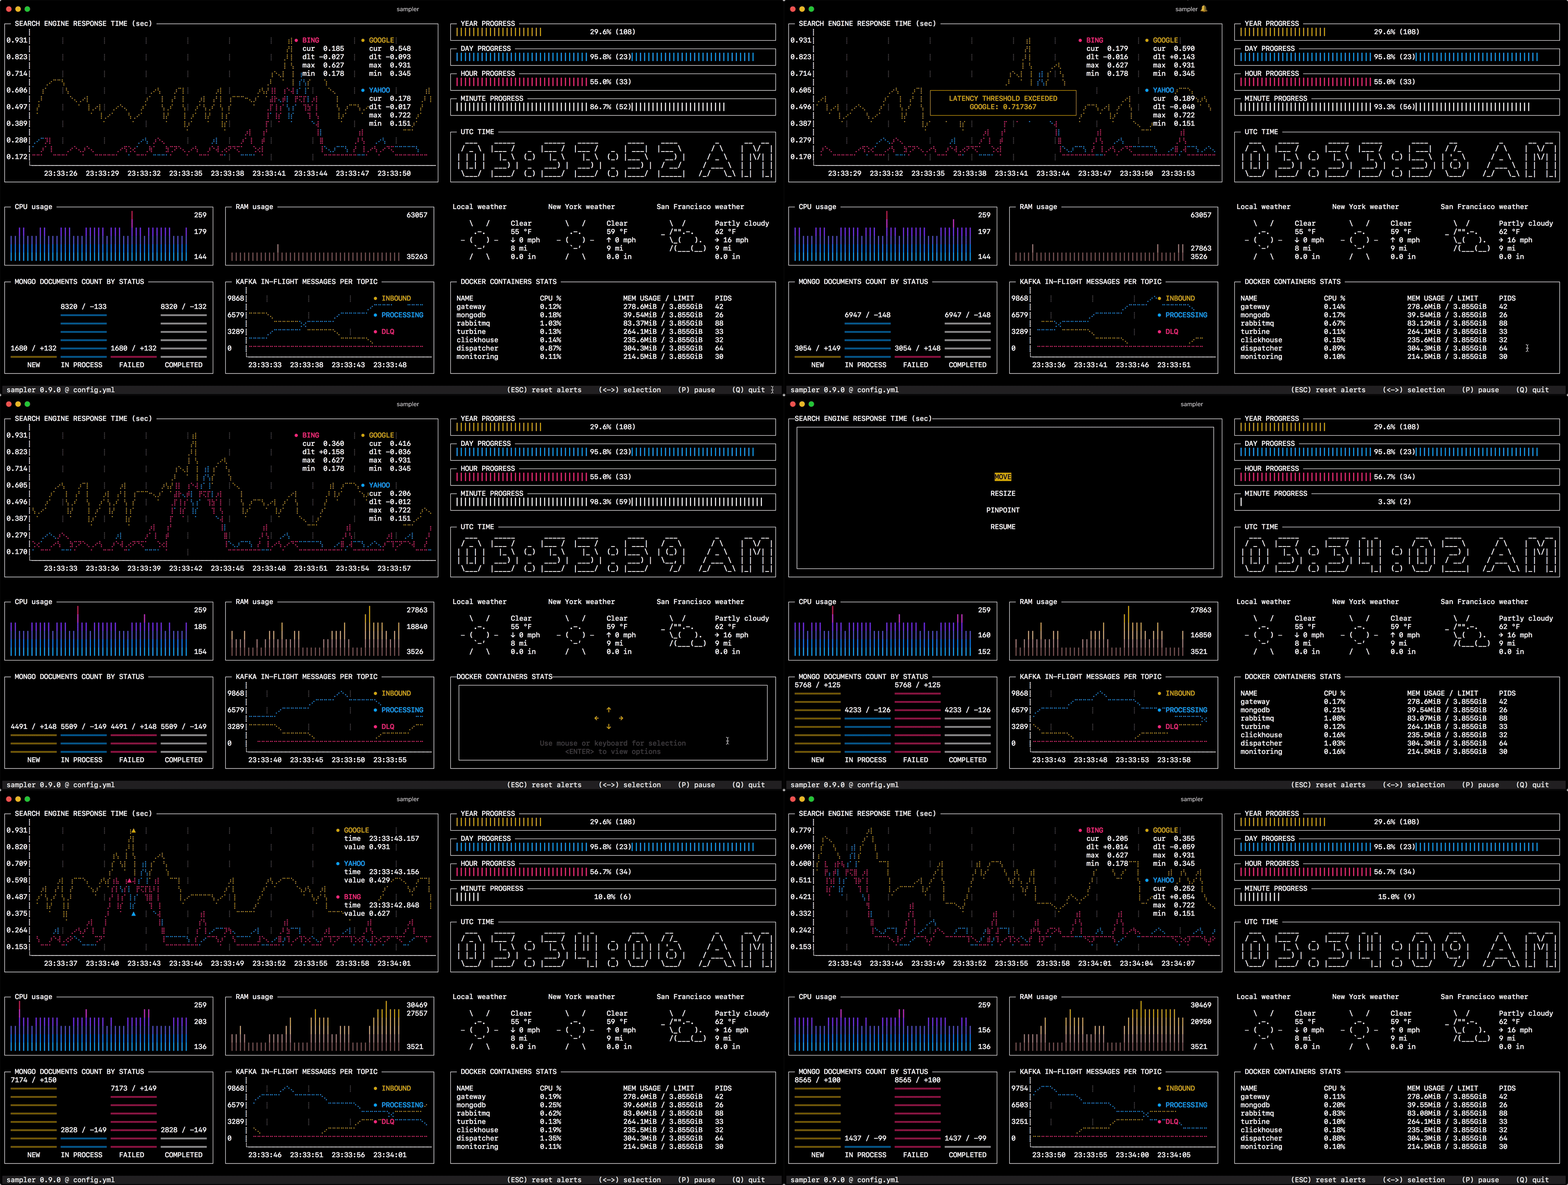
Sampler. Visualization for any shell command.
Sampler is a tool for shell commands execution, visualization and alerting. Configured with a simple YAML file.
Installation
macOS
...
Linux
...
Windows
...
Usage
You specify shell commands, Sampler executes them with a required rate. The output is used for visualization.
One can sample any dynamic process right from the terminal - observe changes in the database, monitor MQ in-flight messages, trigger deployment process and get notification when it's done.
Using Sampler is basically a 3-step process:
- Define your configuration in a YAML file
- Run
sampler -c config.yml - Adjust components size and location on UI
Configuration
Components
Runchart
runcharts:
  - title: Search engine response time
    rate-ms: 500        # sampling rate, default = 1000
    scale: 2            # number of digits after sample decimal point, default = 1
    legend:
      enabled: true     # enables item labels, default = true
      details: false    # enables item statistics: cur/min/max/dlt values, default = true
    items:
      - label: GOOGLE
        sample: curl -o /dev/null -s -w '%{time_total}'  https://www.google.com
        color: 178      # 8-bit color number, default one is chosen from a pre-defined palette
      - label: YAHOO
        sample: curl -o /dev/null -s -w '%{time_total}'  https://search.yahoo.com
      - label: BING
        sample: curl -o /dev/null -s -w '%{time_total}'  https://www.bing.com
Sparkline
sparklines:
- title: CPU usage
  rate-ms: 200          # sampling rate, default = 1000
  scale: 0              # number of digits after sample decimal point, default = 1
  sample: ps -A -o %cpu | awk '{s+=$1} END {print s}'
Barchart
barcharts:
  - title: Local network activity
    rate-ms: 500        # sampling rate, default = 1000
    scale: 0            # number of digits after sample decimal point, default = 1
    items:
      - label: UDP bytes in
        sample: nettop -J bytes_in -l 1 -m udp | awk '{sum += $4} END {print sum}'
      - label: UDP bytes out
        sample: nettop -J bytes_out -l 1 -m udp | awk '{sum += $4} END {print sum}'
      - label: TCP bytes in
        sample: nettop -J bytes_in -l 1 -m tcp | awk '{sum += $4} END {print sum}'
      - label: TCP bytes out
        sample: nettop -J bytes_out -l 1 -m tcp | awk '{sum += $4} END {print sum}'
Gauge
gauges:
  - title: Minute progress
    rate-ms: 500        # sampling rate, default = 1000
    scale: 2            # number of digits after sample decimal point, default = 1
    color: 39           # 8-bit color number, default one is chosen from a pre-defined palette
    cur:
      sample: date +%S  # sample script for current value
    max:
      sample: echo 60   # sample script for max value
    min:
      sample: echo 0    # sample script for min value
Textbox
textboxes:
  - title: Local weather
    rate-ms: 10000      # sampling rate, default = 1000
    sample: curl wttr.in?0ATQF
    border: false       # border around the item, default = true
    color: 178          # 8-bit color number, default is white
  - title: Docker containers stats
    rate-ms: 500
    sample: docker stats --no-stream --format "table {{.Name}}\t{{.CPUPerc}}\t{{.MemUsage}}\t{{.PIDs}}"
Asciibox
asciiboxes:
  - title: UTC time
    rate-ms: 500        # sampling rate, default = 1000
    font: 3d            # font type, default = 2d
    color: 178          # 8-bit color number, default is white
    sample: env TZ=UTC date +%r
Bells and whistles
Triggers
Triggers allow to perform conditional actions, like visual/sound alerts or an arbitrary shell command.
Interactive shell support
In addition to the sample command, one can specify init command (executed only once before sampling) and transform command (to post-process sample command output). That covers interactive shell use case, e.g. to establish connection to a database only once, and then perform polling within interactive shell session. MongoDB example: ...
Variables
If the configuration file contains repeated patterns, they can be extracted into the variables section.
Also variables can be specified using -v/--variable flag on startup, and any system environment variables will also be available in the scripts.
Color theme
...
Real-world examples
...
